Sample SEO Audit Report

See how raw test output becomes a practical plan. This anonymized excerpt focuses on page performance: what the test found, why it matters, what should be fixed first, and how improvement is verified.

Client and domain details have been removed. The screenshots are examples from a third-party testing tool, not a promise of ranking or revenue results.

Included here
Loading, interaction, page weight, requests, and layout stability
Not shown
Crawling, indexing, content, local SEO, links, analytics, and conversion tracking
Purpose
Show the reasoning behind an audit, not just the score

How an audit finding becomes an action

A useful report keeps the evidence, consequence, work, and measurement connected. It does not hand over a list of tool warnings and leave the client to interpret them.

  1. Capture the evidence

    Record the test conditions, page timings, transfer size, request count, and specific diagnostics before recommending a change.

  2. Interpret the signal

    Separate a symptom from its likely cause and compare controlled lab results with real-user field data where both are available.

  3. Set the priority

    Balance severity, affected templates, user impact, implementation effort, and business importance. A tool label is only one input.

  4. Fix and verify

    Assign the work, repeat the same test, review field data after release, and confirm that the change did not create a new problem.

The first read: fast paint, slow finish

The page starts well in this controlled test, but it keeps doing substantial work after the first content appears. That distinction changes the recommendation.

What we would report: visual loading is not the main failure. Transfer weight and main-thread blocking are the better first targets.

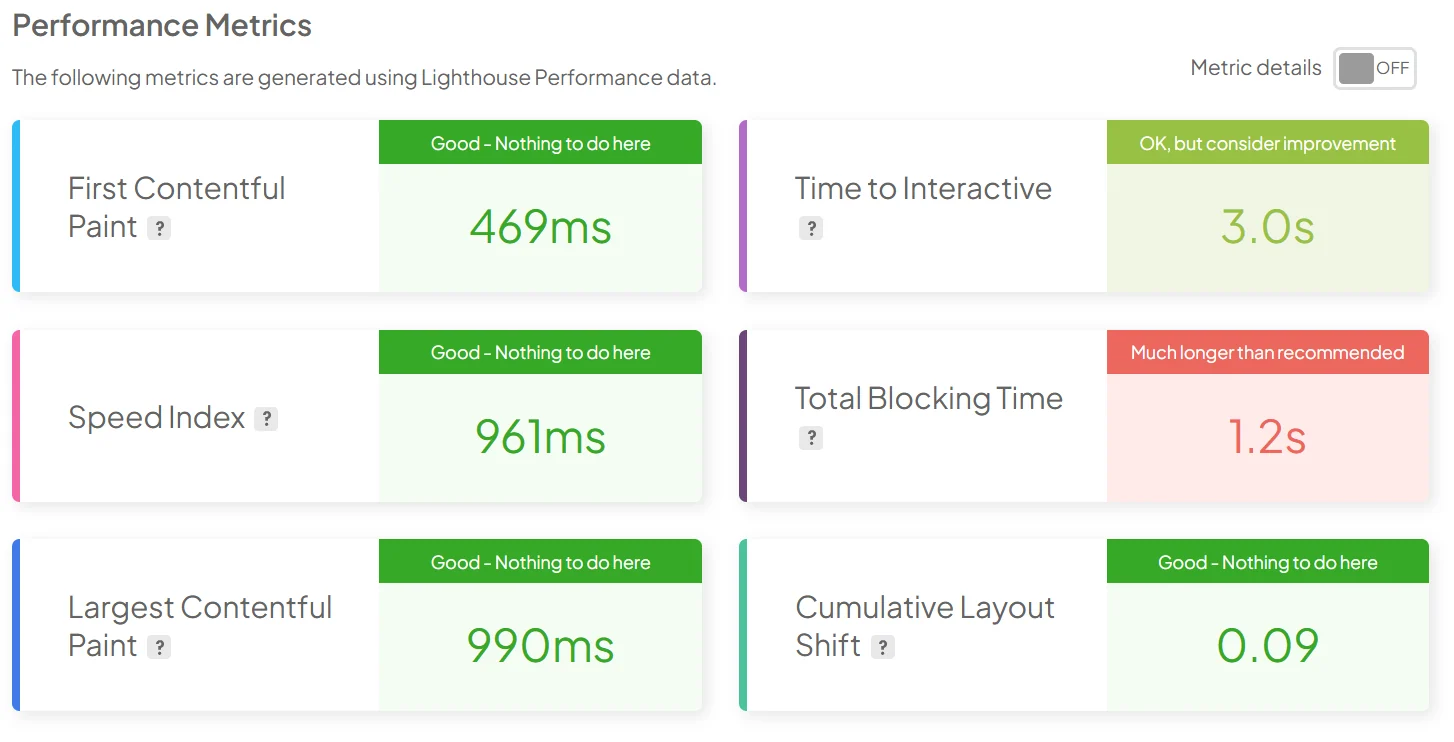
Performance metric panel showing fast first paint and largest contentful paint, good layout stability, and a much longer than recommended total blocking time
Sample lab metrics. The initial paint values are healthy, while Total Blocking Time is the outlier that needs investigation.Open full-size image
469 ms FCP and 990 ms LCPContent appears quickly in this lab run. These results do not explain how every visitor experiences the page.
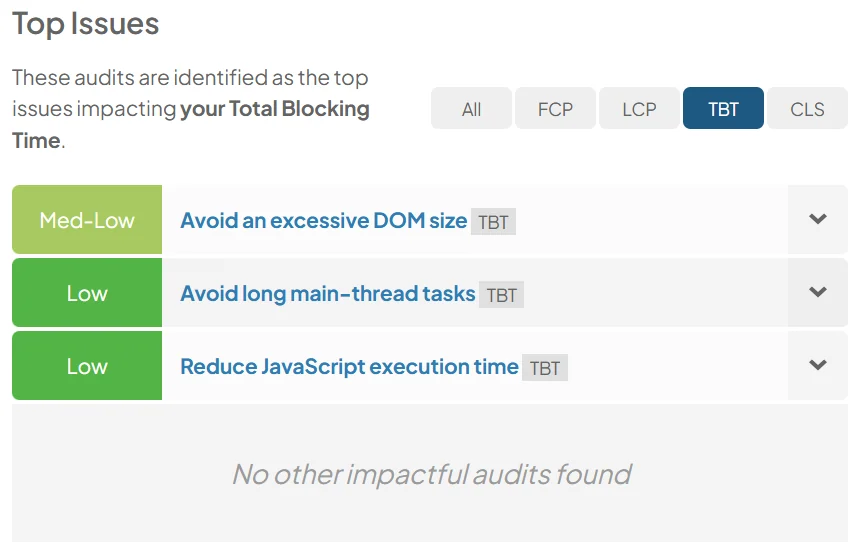
1.2 s Total Blocking TimeThe browser spent too long on main-thread work during the test. A page may look available before it responds smoothly.
0.09 CLSThe tested page is visually stable. Layout-shift recommendations still matter as preventive template work.

A tool severity label is not the final priority

The audit reviews the diagnostics, then orders the work by likely user impact, affected page coverage, implementation effort, and business importance.

Priority 1

Reduce the transfer payload

The video and image weight dominate a 31.4 MB page. This is the clearest high-impact opportunity in the sample.

Priority 2

Cut main-thread blocking

A page can look ready while JavaScript and DOM work delay interaction. The 1.2 second lab TBT warrants investigation.

Priority 3

Protect LCP and layout stability

Current LCP and CLS values are good, but image loading and dimension warnings can create regressions across templates.

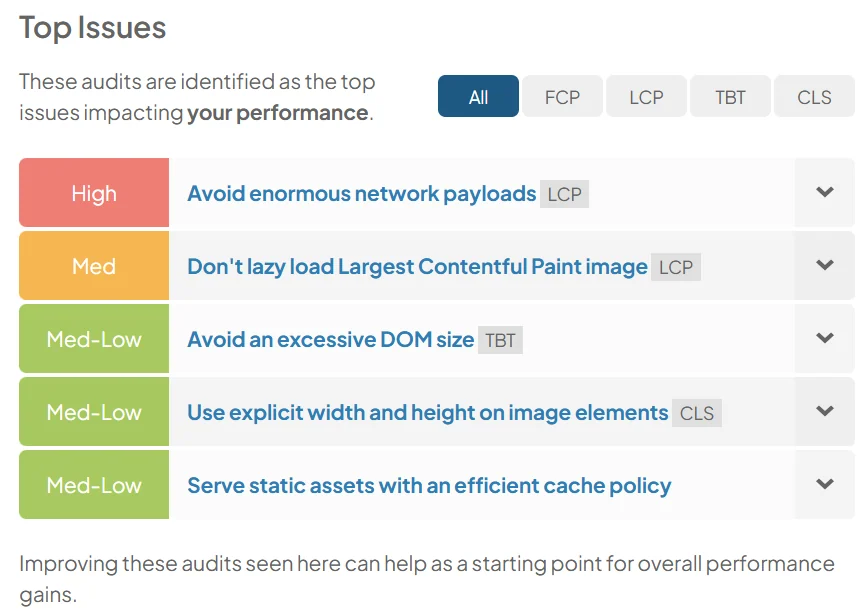
Top performance issues ordered by severity, including enormous network payloads, lazy loading the largest image, DOM size, image dimensions, and cache policy
The issue list starts the investigation. The audit determines which warning deserves action first.Open full-size image

Priority 1 · high

The page is far heavier than the quick first paint suggests

The tested page reaches 31.4 MB and 111 requests, then continues loading until 8.3 seconds. Video accounts for most of the transfer size.

Evidence
25.7 MB video, 4.99 MB images, 111 requests
Likely owner
Frontend development with media and content support
Verification
Repeat the same test and compare transfer size, request count, and fully loaded time
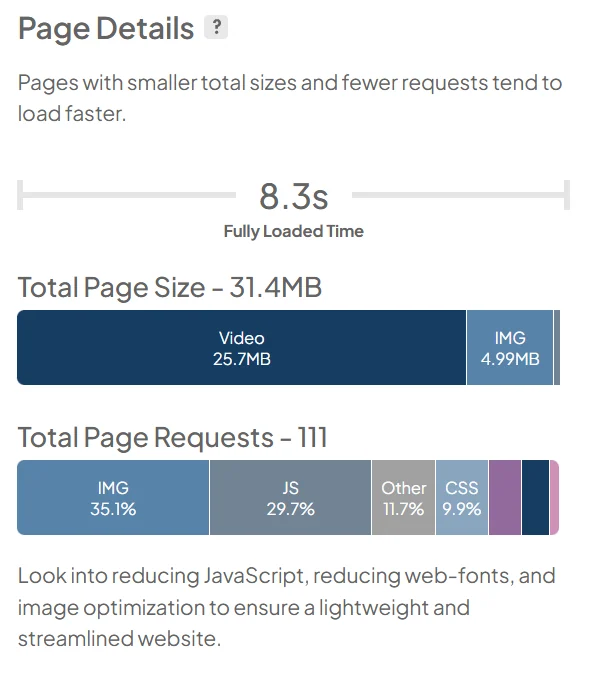
Page details showing an 8.3 second fully loaded time, 31.4 megabyte page size, 25.7 megabytes of video, and 111 requests
The total payload reveals work that a fast first paint can hide.Open full-size image

Why it matters

Visitors on slower connections or limited devices may wait longer, use more mobile data, or leave before secondary assets finish. The result is a user-experience risk, not proof of lost rankings or leads.

Recommended work

  • Replace immediate video transfer with a poster and load playback assets only when needed.
  • Compress and resize images for their rendered dimensions.
  • Remove duplicate or unused requests and set an appropriate cache policy.

Done means verified

Test the same URL under the same device, network, and location settings. Confirm the page became lighter without delaying the main content or breaking video playback.

Priority 2 · investigate

Visible is not the same as responsive

A 1.2 second Total Blocking Time suggests that scripts or rendering work occupied the main thread for too long in the lab test. During those tasks, clicks, taps, and typing can feel delayed.

TBT is a lab diagnostic and a useful proxy for responsiveness. It is not the same measurement as real-user Interaction to Next Paint.

Recommended work

  • Profile long tasks and reduce JavaScript execution.
  • Defer nonessential scripts and review third-party tags.
  • Reduce excessive DOM work on repeated templates.
  • Validate the change with lab TBT and field INP.
Total Blocking Time diagnostics listing excessive DOM size, long main-thread tasks, and JavaScript execution time
The diagnostics point to likely causes. A developer trace is still needed before changing code.Open full-size image

Good current scores can still expose regression risks

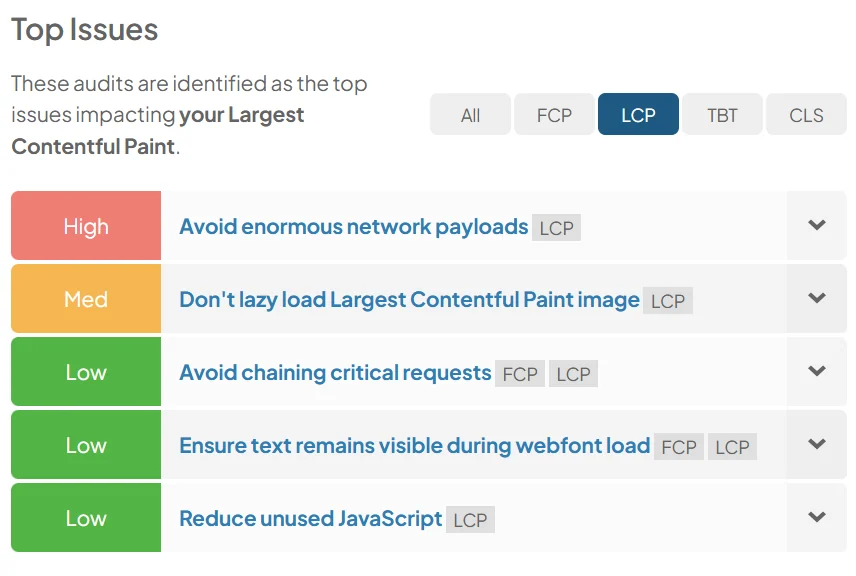
The sample has a healthy lab LCP and CLS. The audit does not manufacture a failure. It records the pass, then addresses implementation warnings that could hurt other pages or future releases.

Largest Contentful Paint diagnostics including payload size, lazy loading, critical request chains, webfont loading, and unused JavaScript
LCP review: keep the largest visible element discoverable and avoid lazy-loading it.Open full-size image
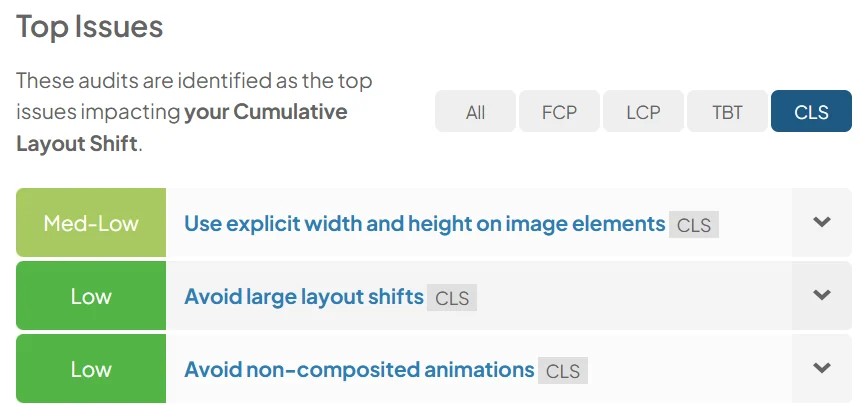
Cumulative Layout Shift diagnostics recommending explicit image dimensions and avoiding large layout shifts and non-composited animations
CLS review: reserve media space and test shifts across repeated templates.Open full-size image

Preserve what works. Do not trade the current 990 ms lab LCP for a lighter page that discovers the main image later.

Fix the template, not one screenshot. Explicit image dimensions and reliable media loading rules reduce future instability.

Lab and field data answer different questions

Controlled lab tests help reproduce and diagnose a problem. Field data describes what recent real visitors experienced across their devices, networks, and locations. Different values are expected.

Use lab data to debug.
Use field data to judge real-world performance and monitor the release.

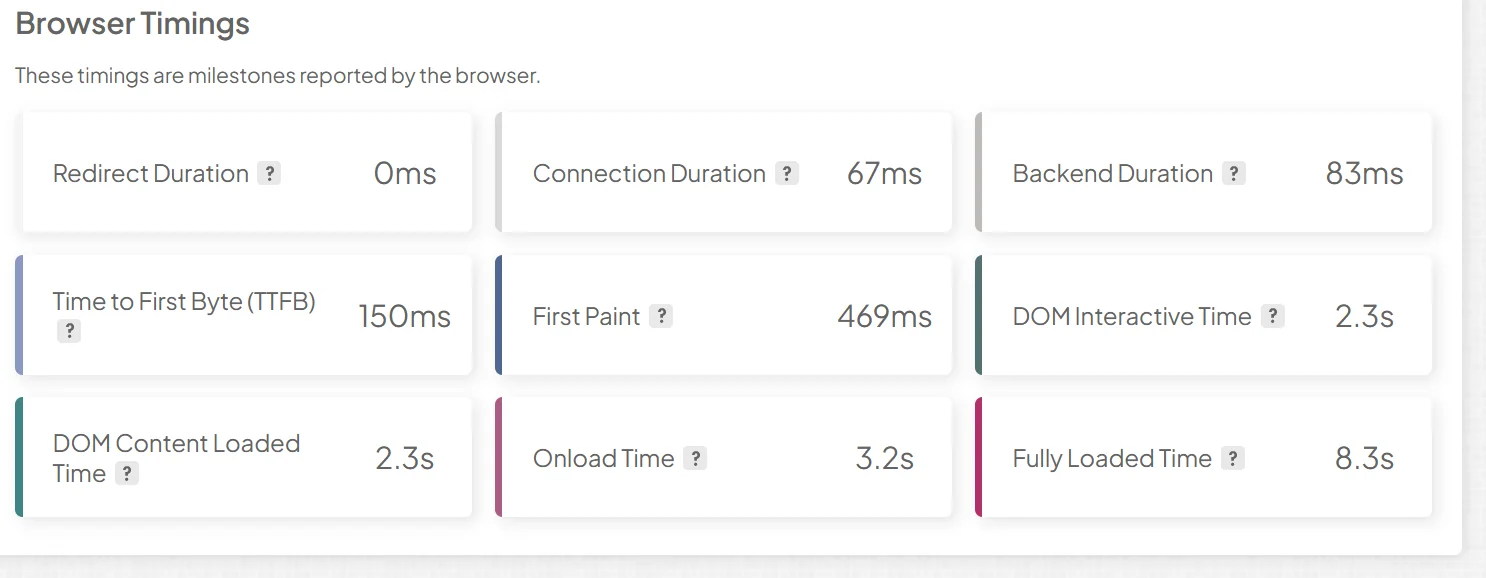
Browser timing milestones including time to first byte, DOM interactive, onload, and fully loaded time
Lab timeline: useful for locating when the browser reached each loading milestone.Open full-size image
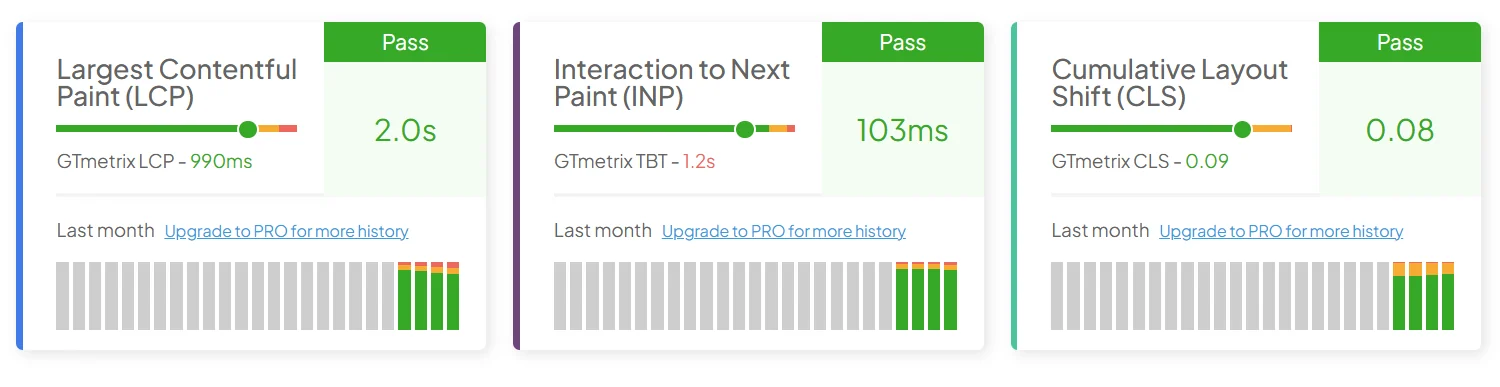
Field Core Web Vitals showing passing Largest Contentful Paint, Interaction to Next Paint, and Cumulative Layout Shift
Field view: recent real-user LCP, INP, and CLS pass in this sample. That does not erase the lab optimization opportunities.Open full-size image

This is one chapter of a full SEO audit

A performance test can expose loading and interaction risks. It cannot, by itself, explain whether important pages are indexed, match search intent, support local visibility, earn links, or generate qualified leads.

  • Crawlability, indexation, canonicals, redirects, and status codes
  • Search intent, page structure, content depth, and internal linking
  • Local visibility, business profiles, reviews, and location evidence
  • Organic landing pages, conversions, lead quality, and measurement gaps
Return to the sample findings

See What the Audit Finds on Your Site

Enter your website to request an audit covering technical issues, search visibility, on-page SEO, local signals, competitors, and the work that should come first.

  • 100% free
  • No login required
  • No obligation

See what we check

  • Technical SEO issues
  • Google visibility
  • On-page SEO
  • Local SEO signals
  • Competitor gaps
  • Priority recommendations

No generic SEO score. We show you what’s wrong, why it matters, and what to fix first.